
Font Size
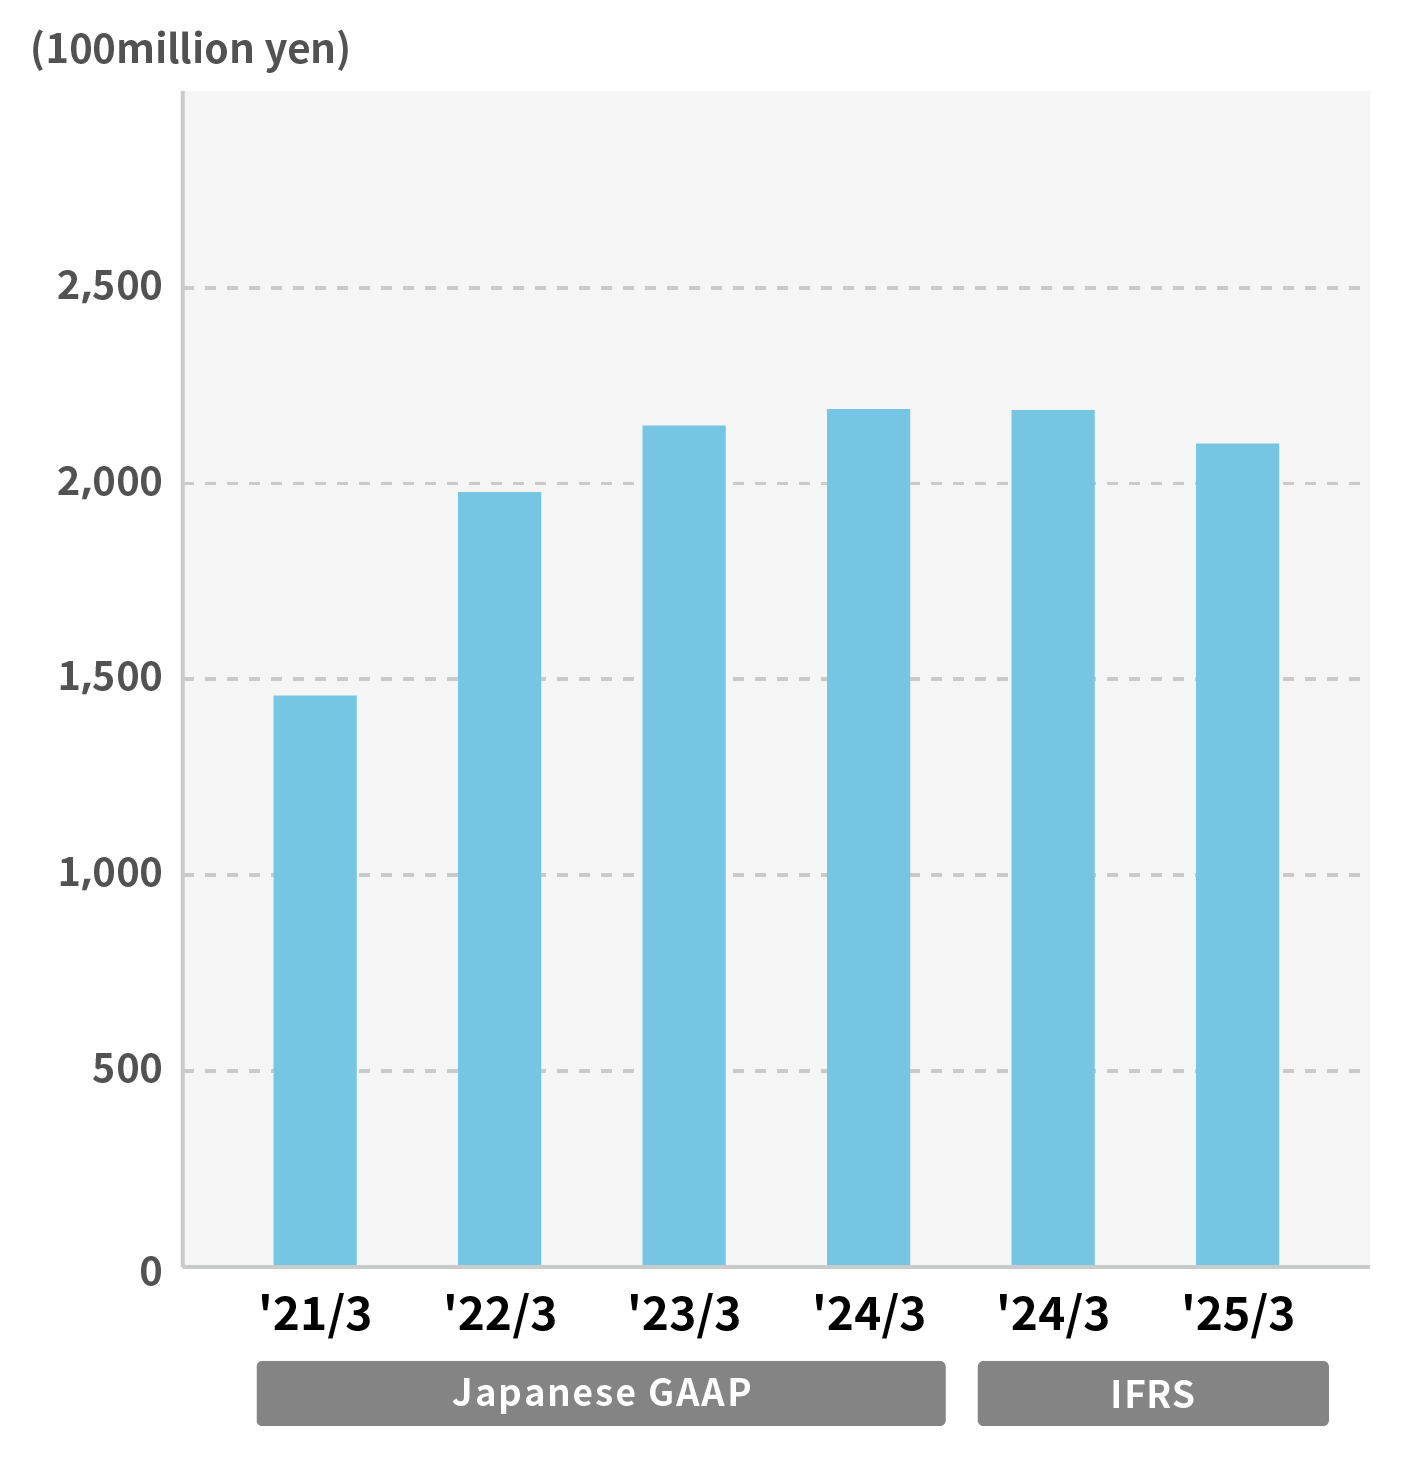
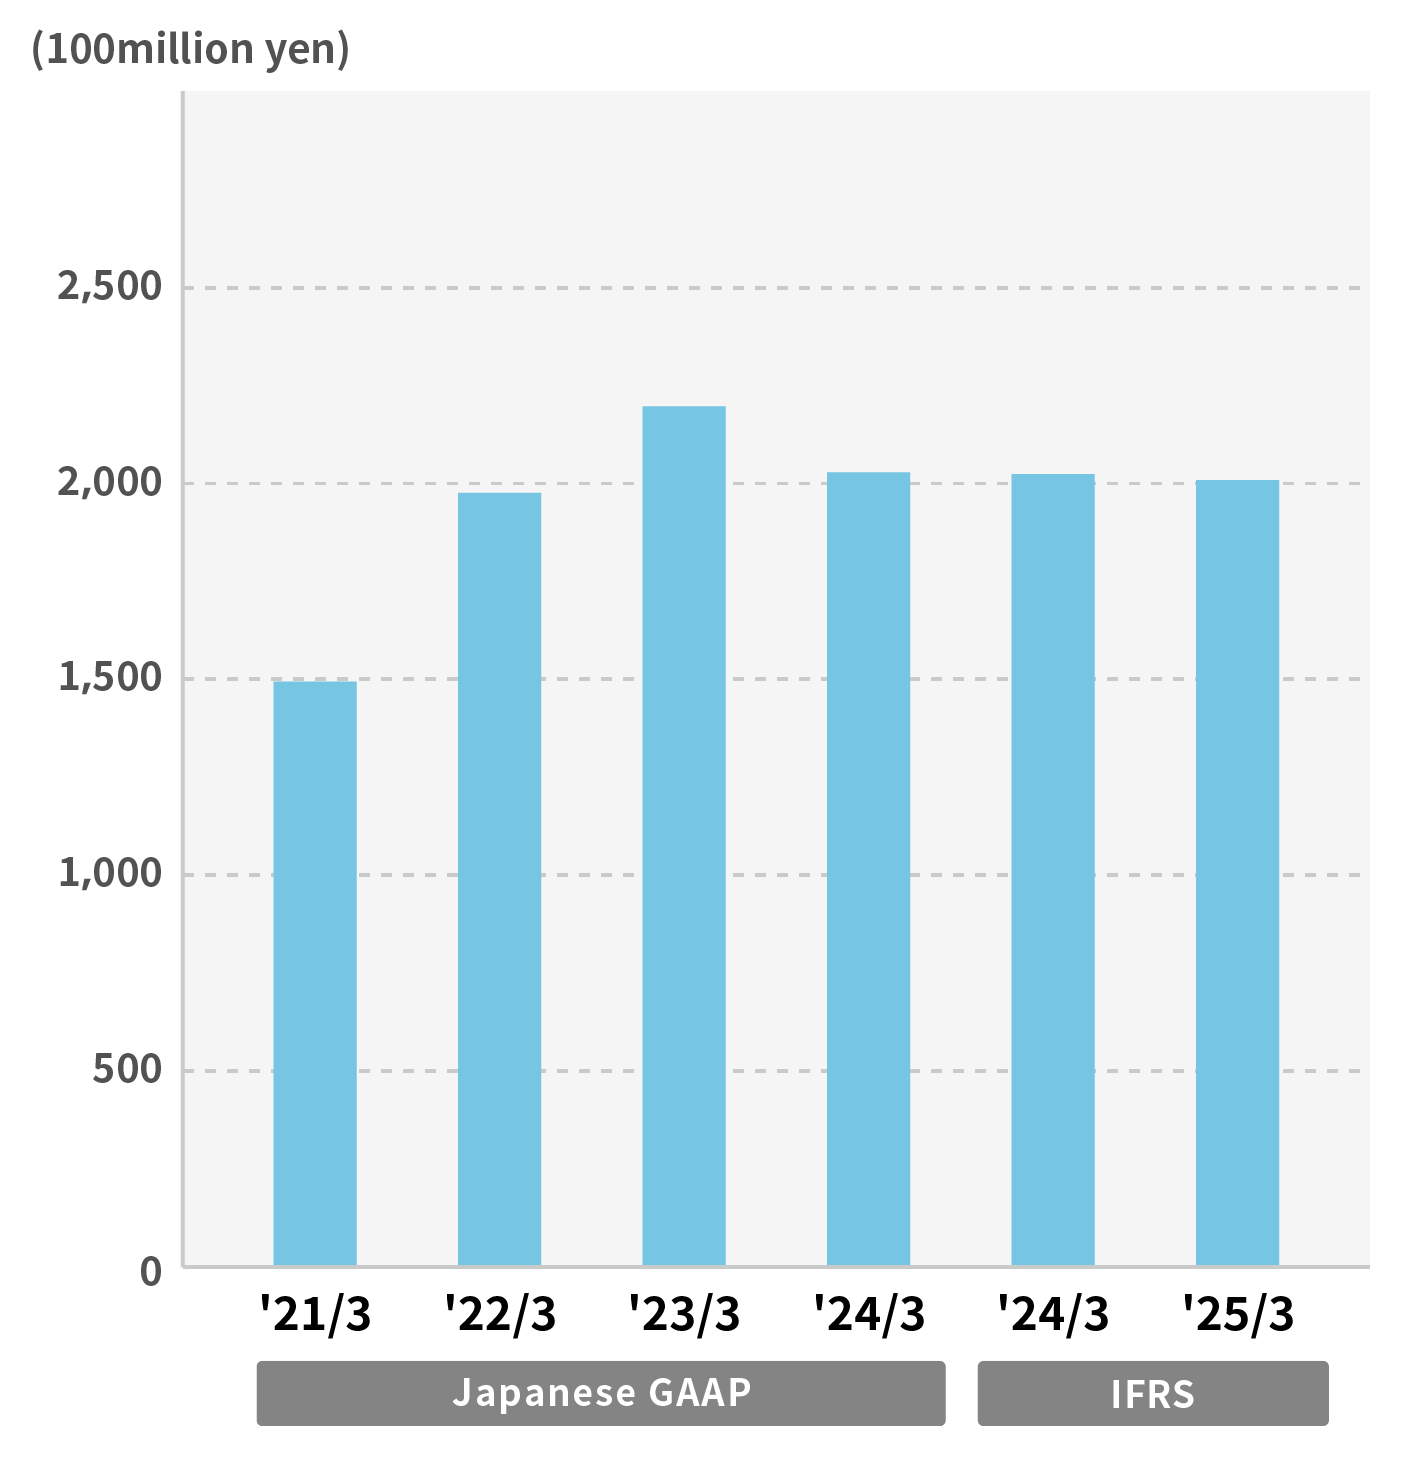
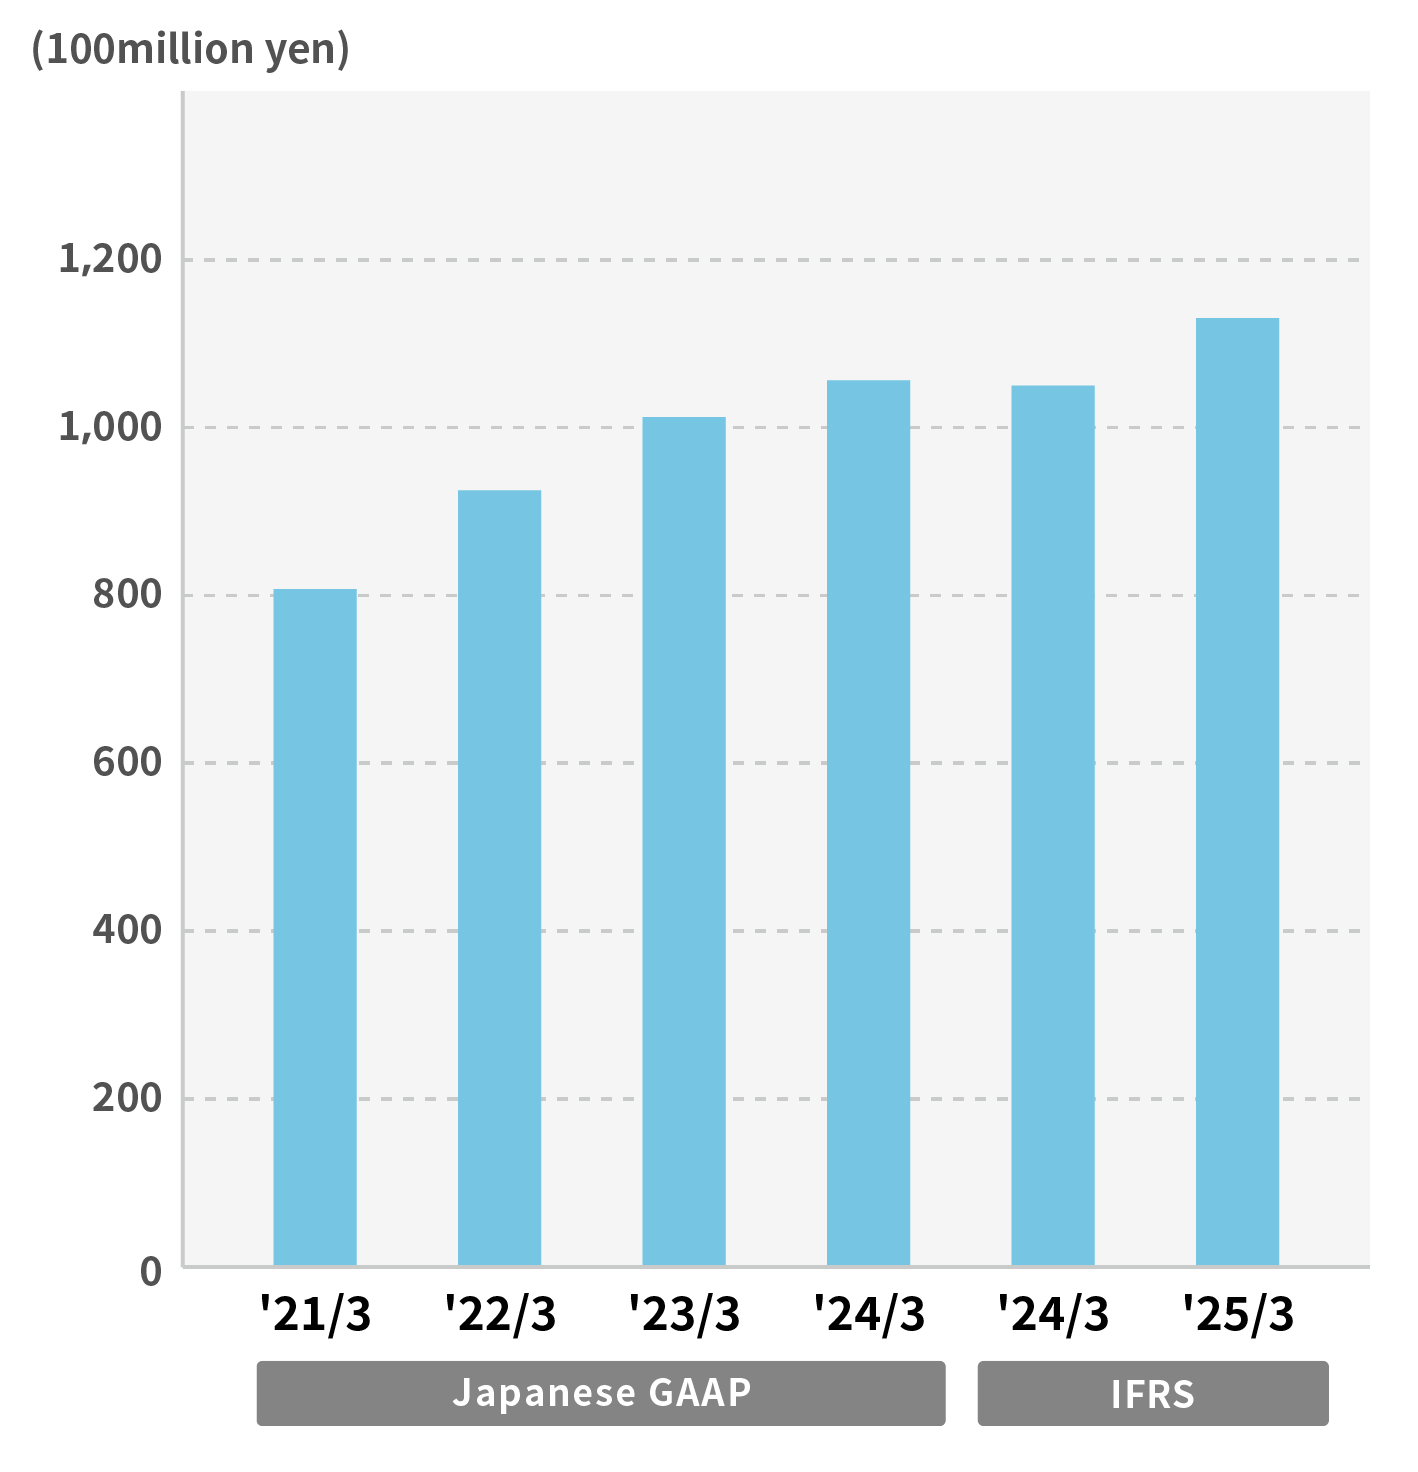
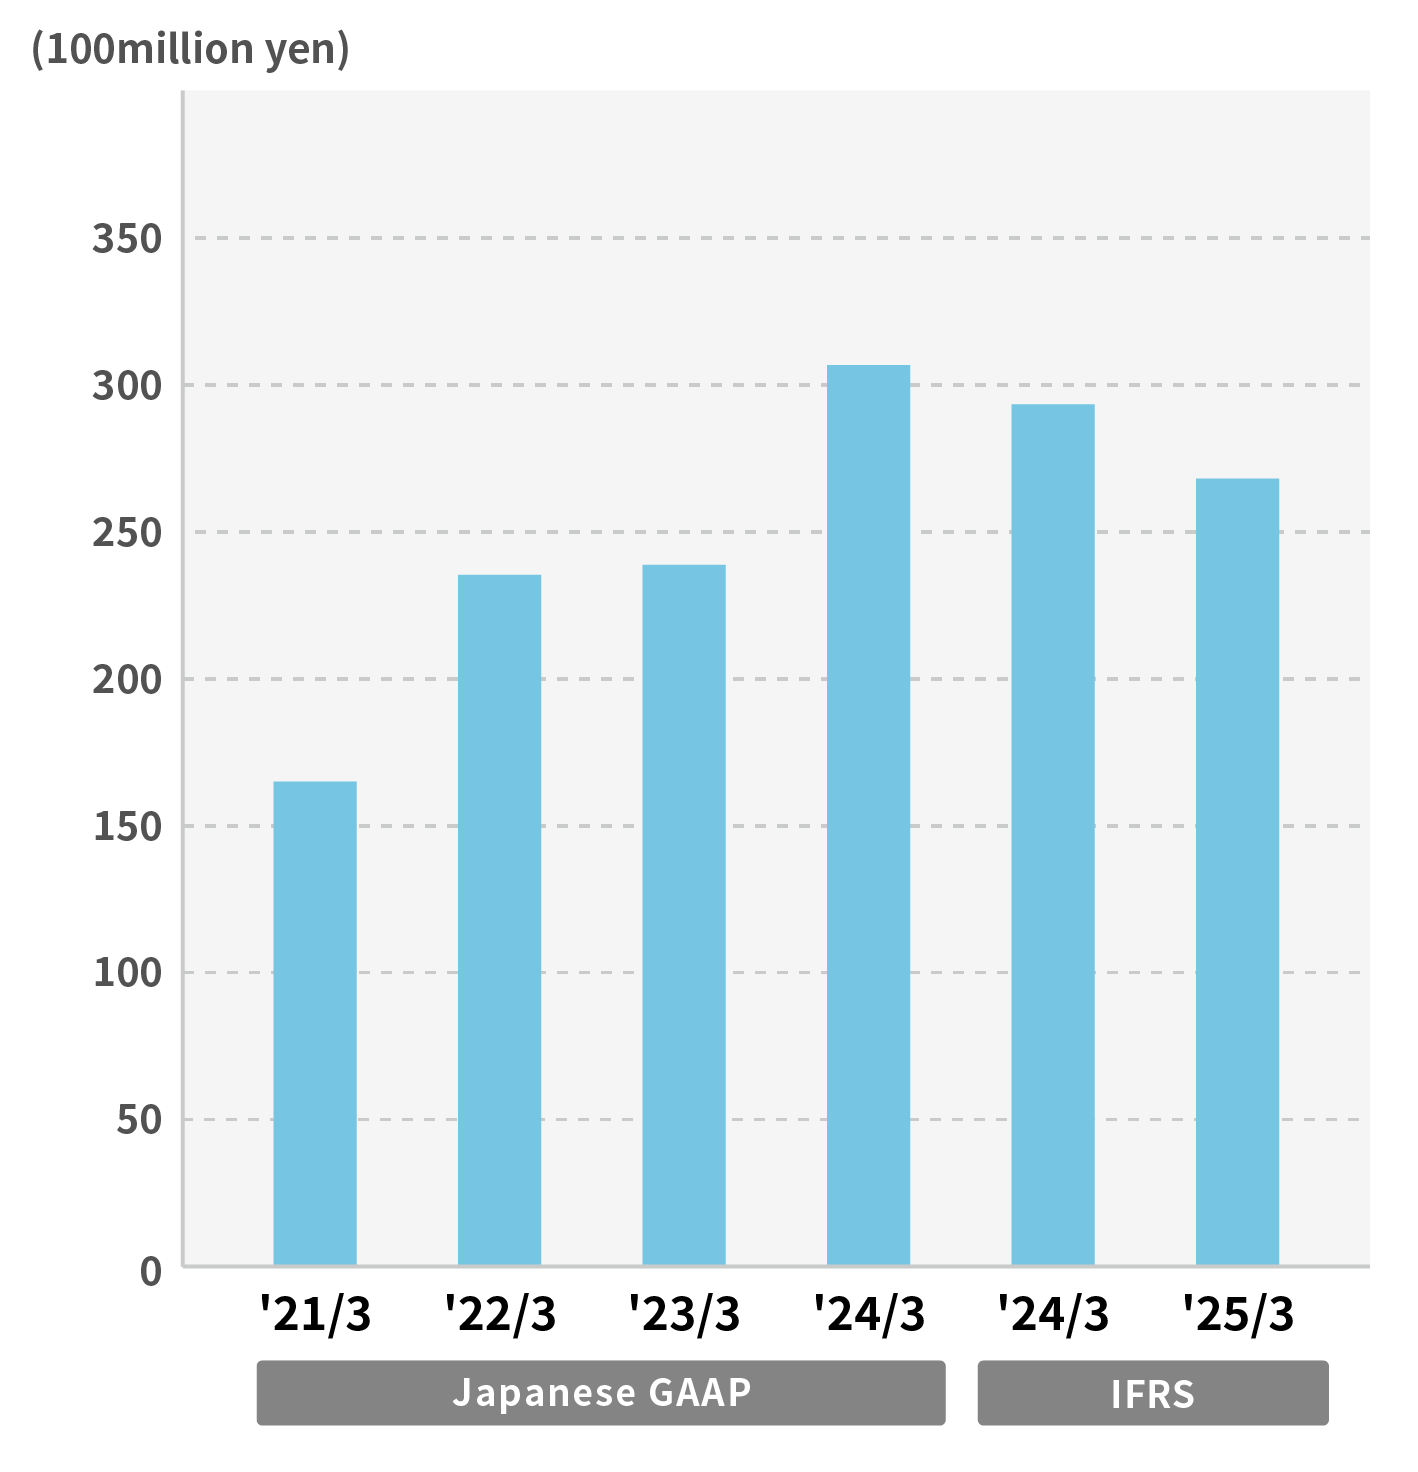
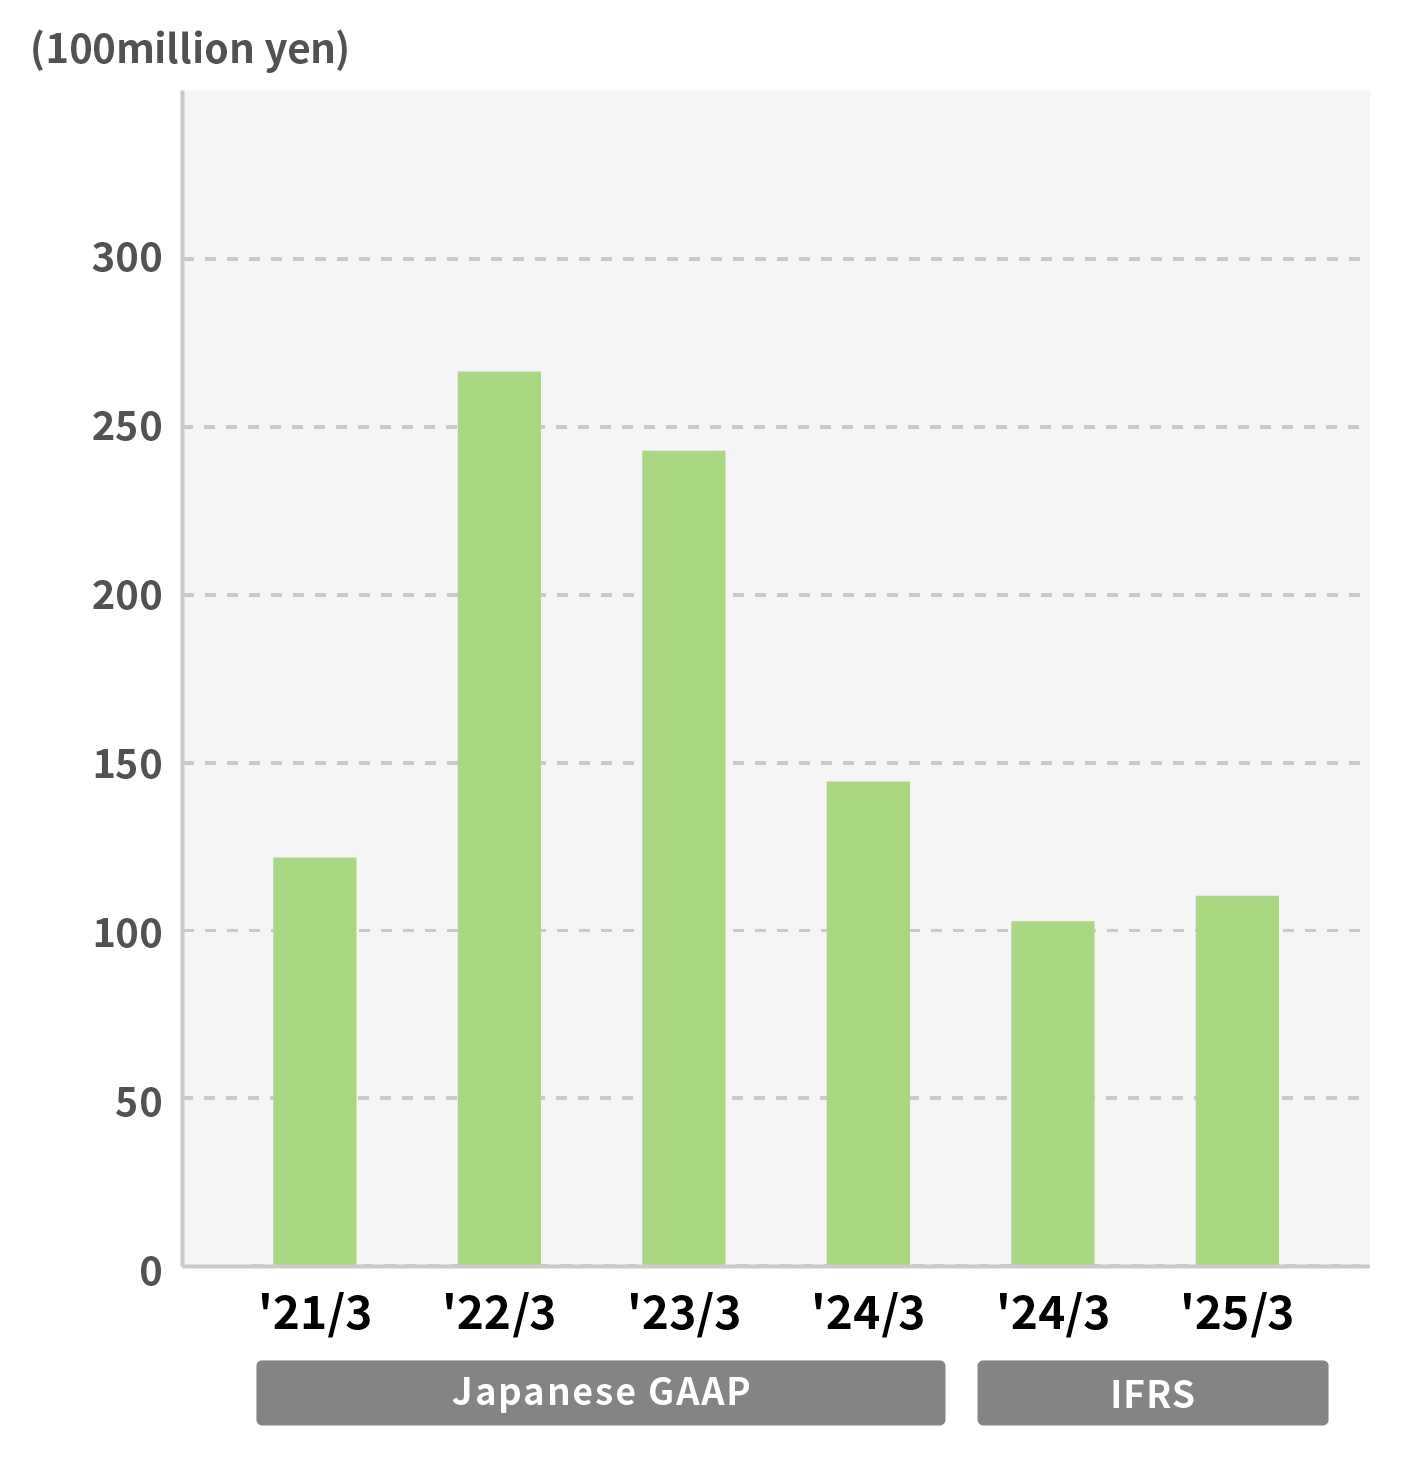
Segment net sales trends
[Specialty Steel]
[High Performance Materials and Magnetic Materials]
[Parts for Automobile & Industrial Equipment]
[Specialty Steel]
[High Performance Materials and Magnetic Materials]
[Parts for Automobile & Industrial Equipment]
[Engineering]
[Trading & Service]
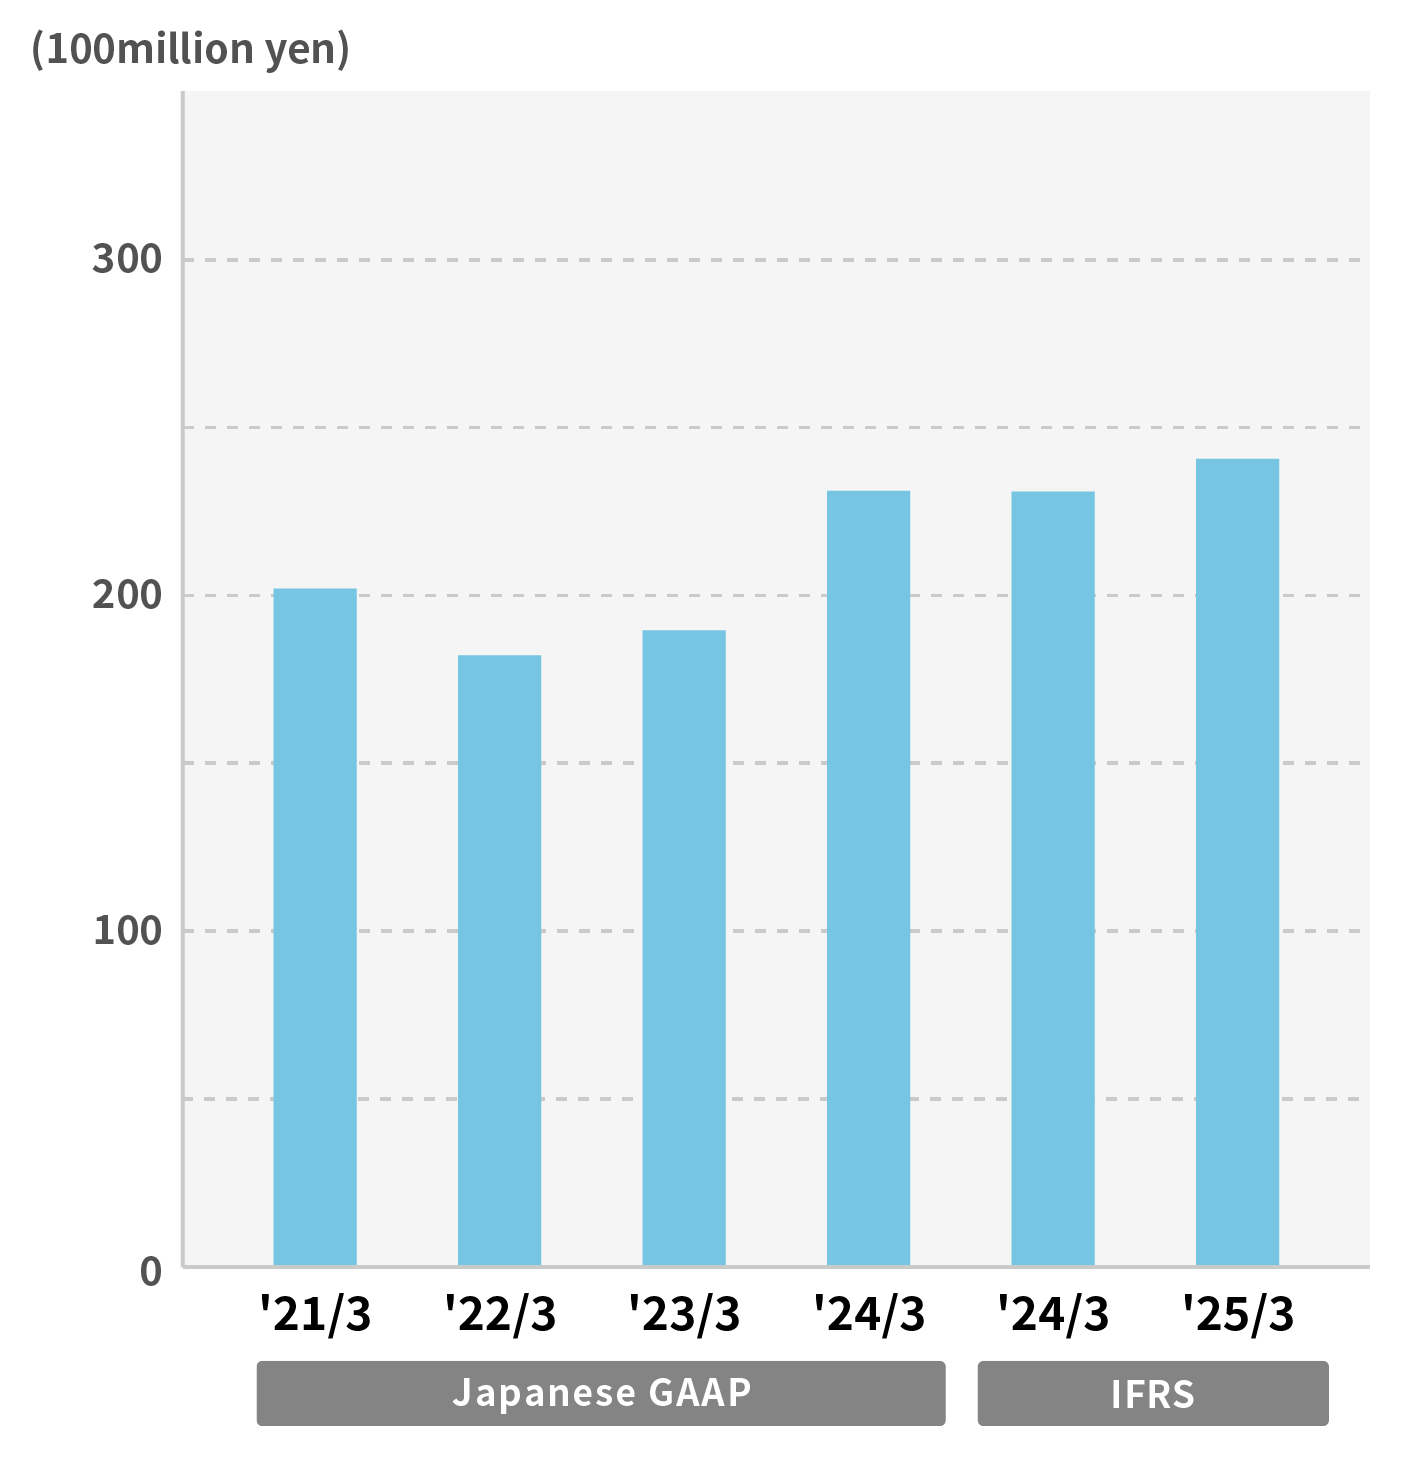
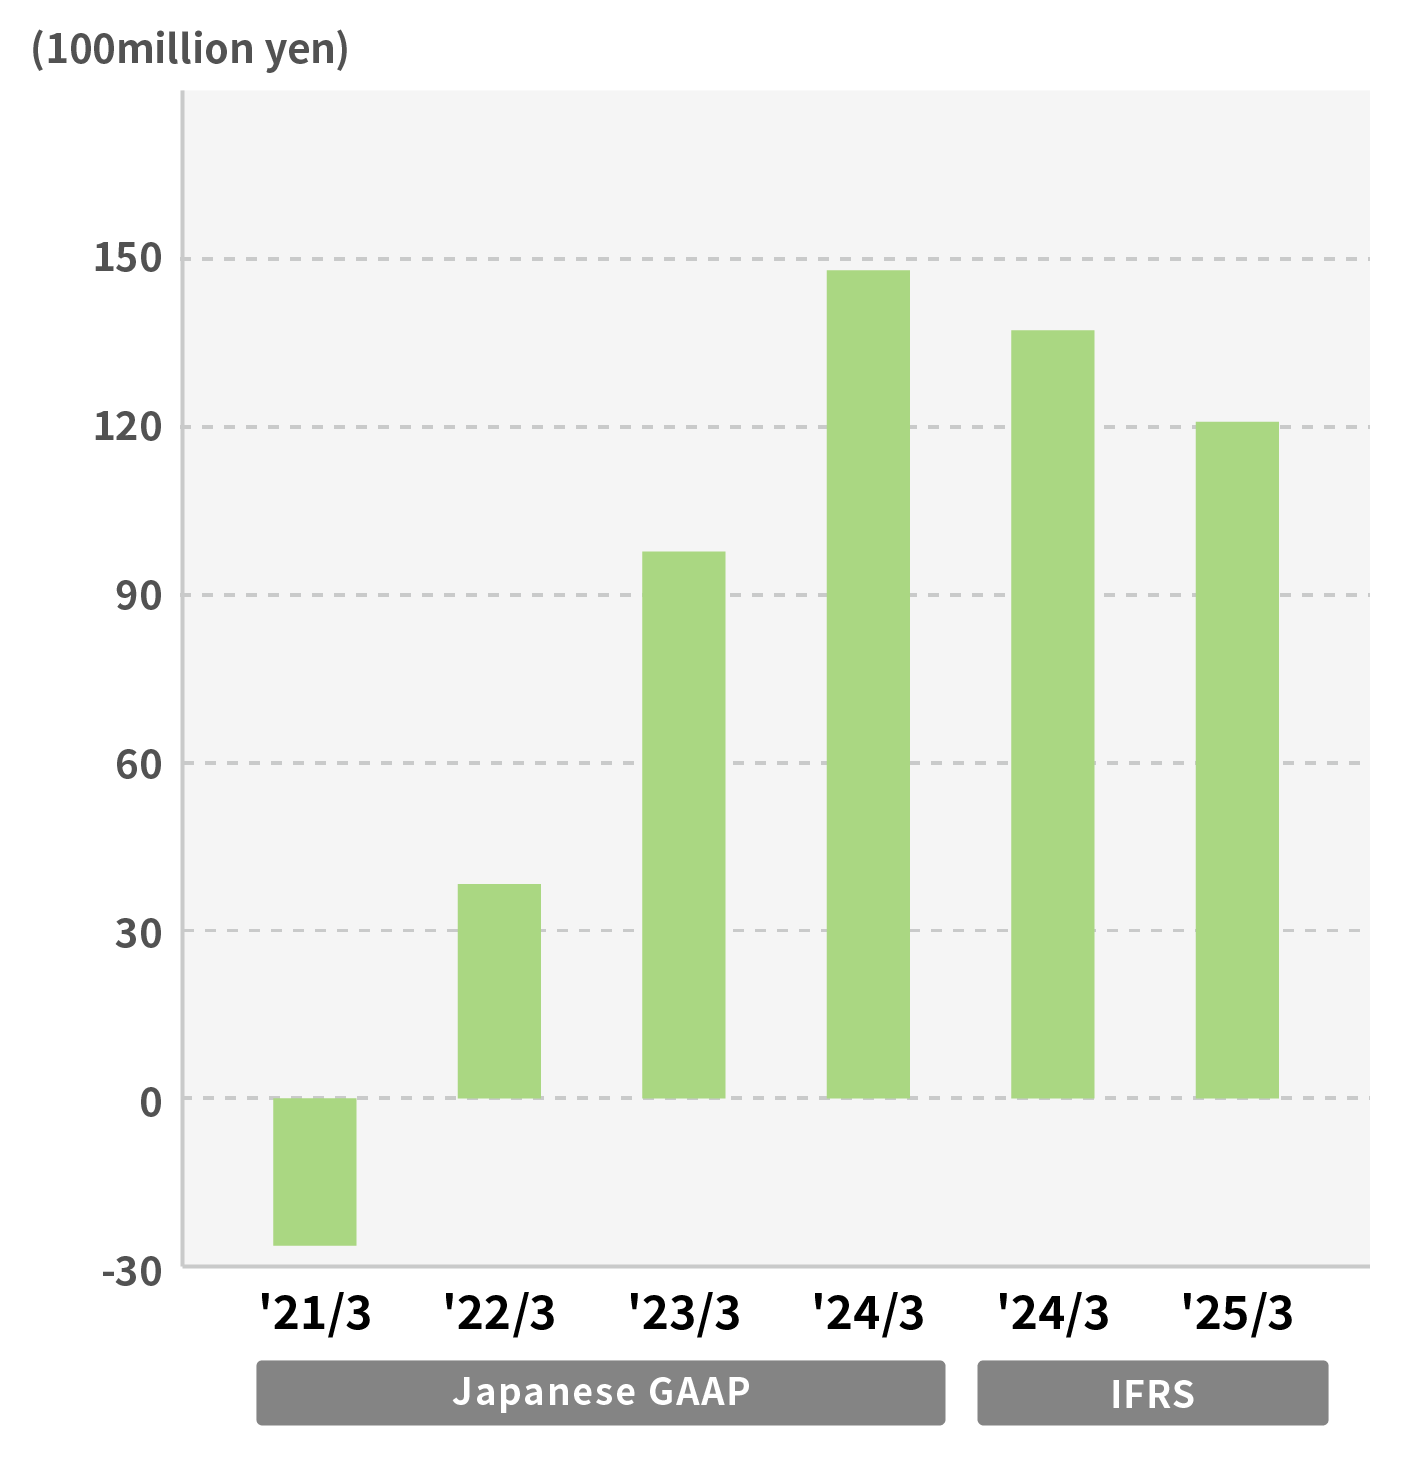
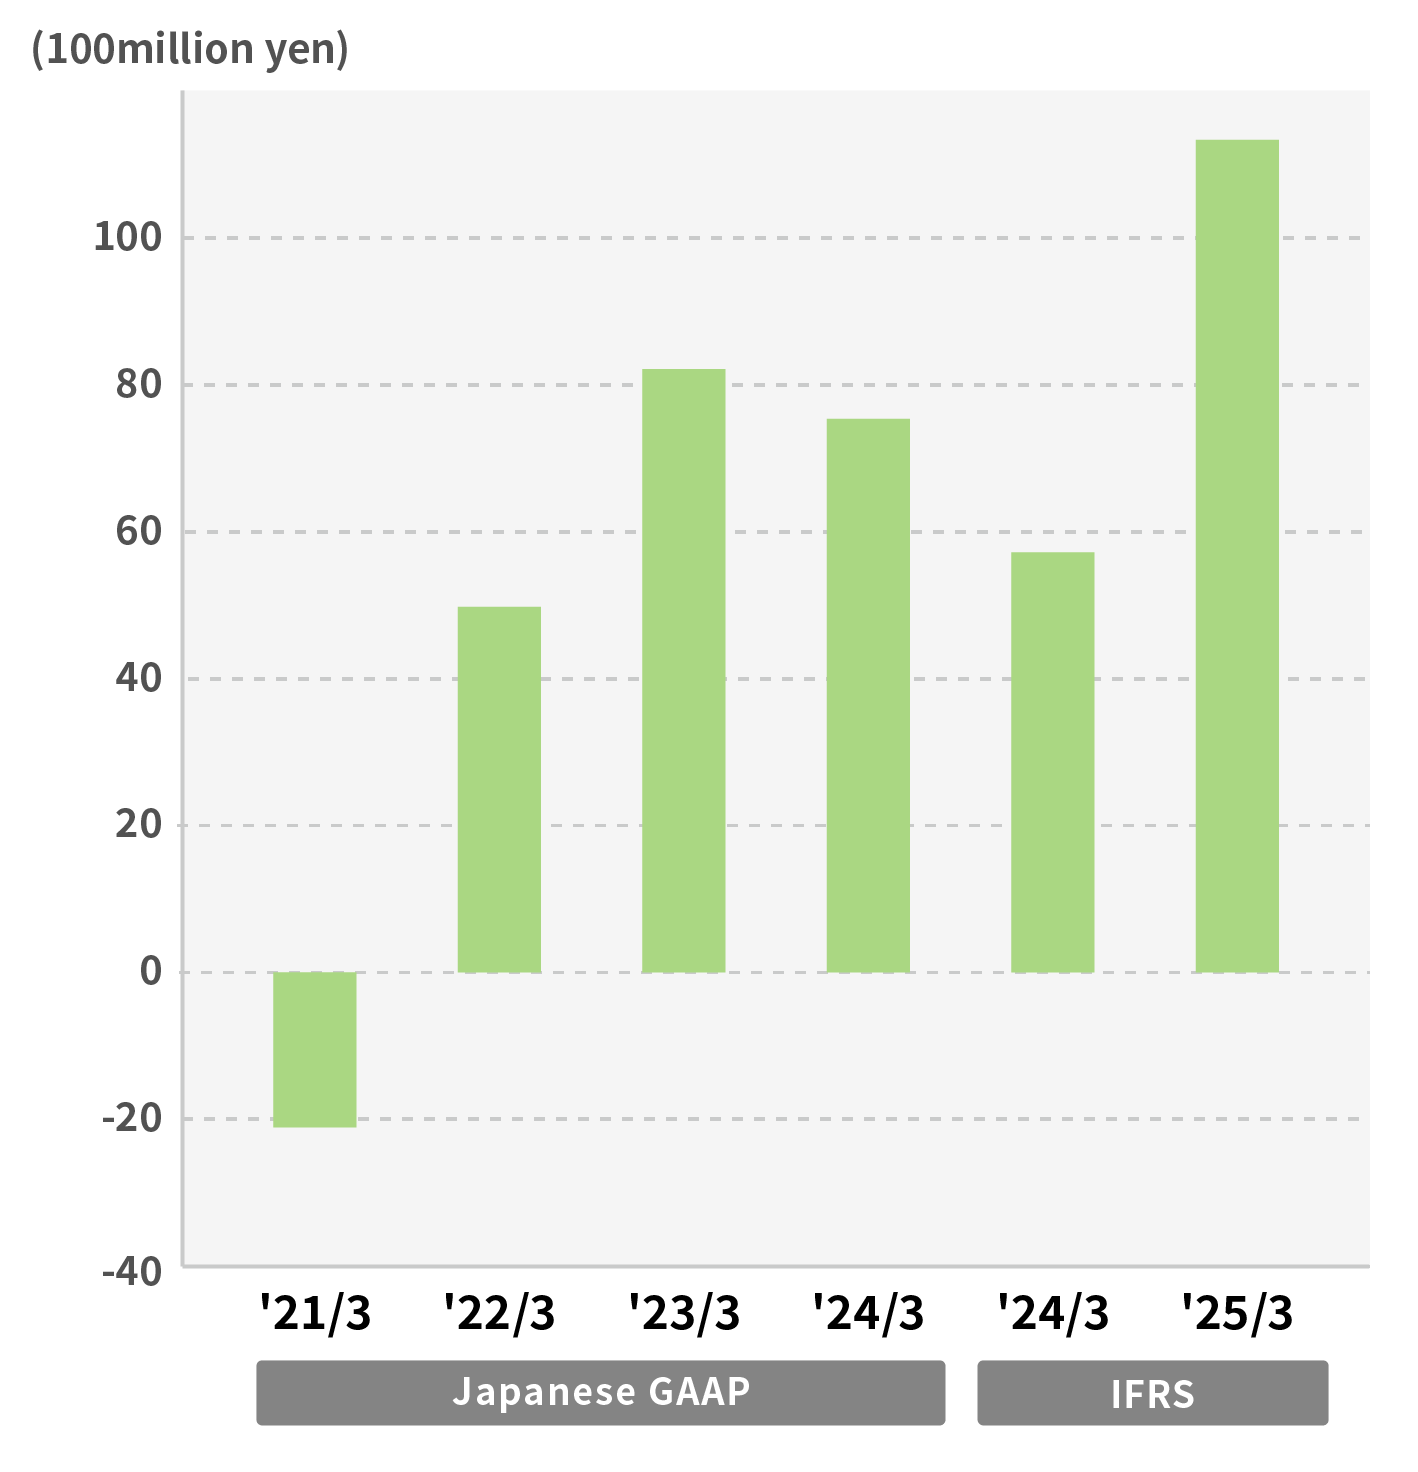
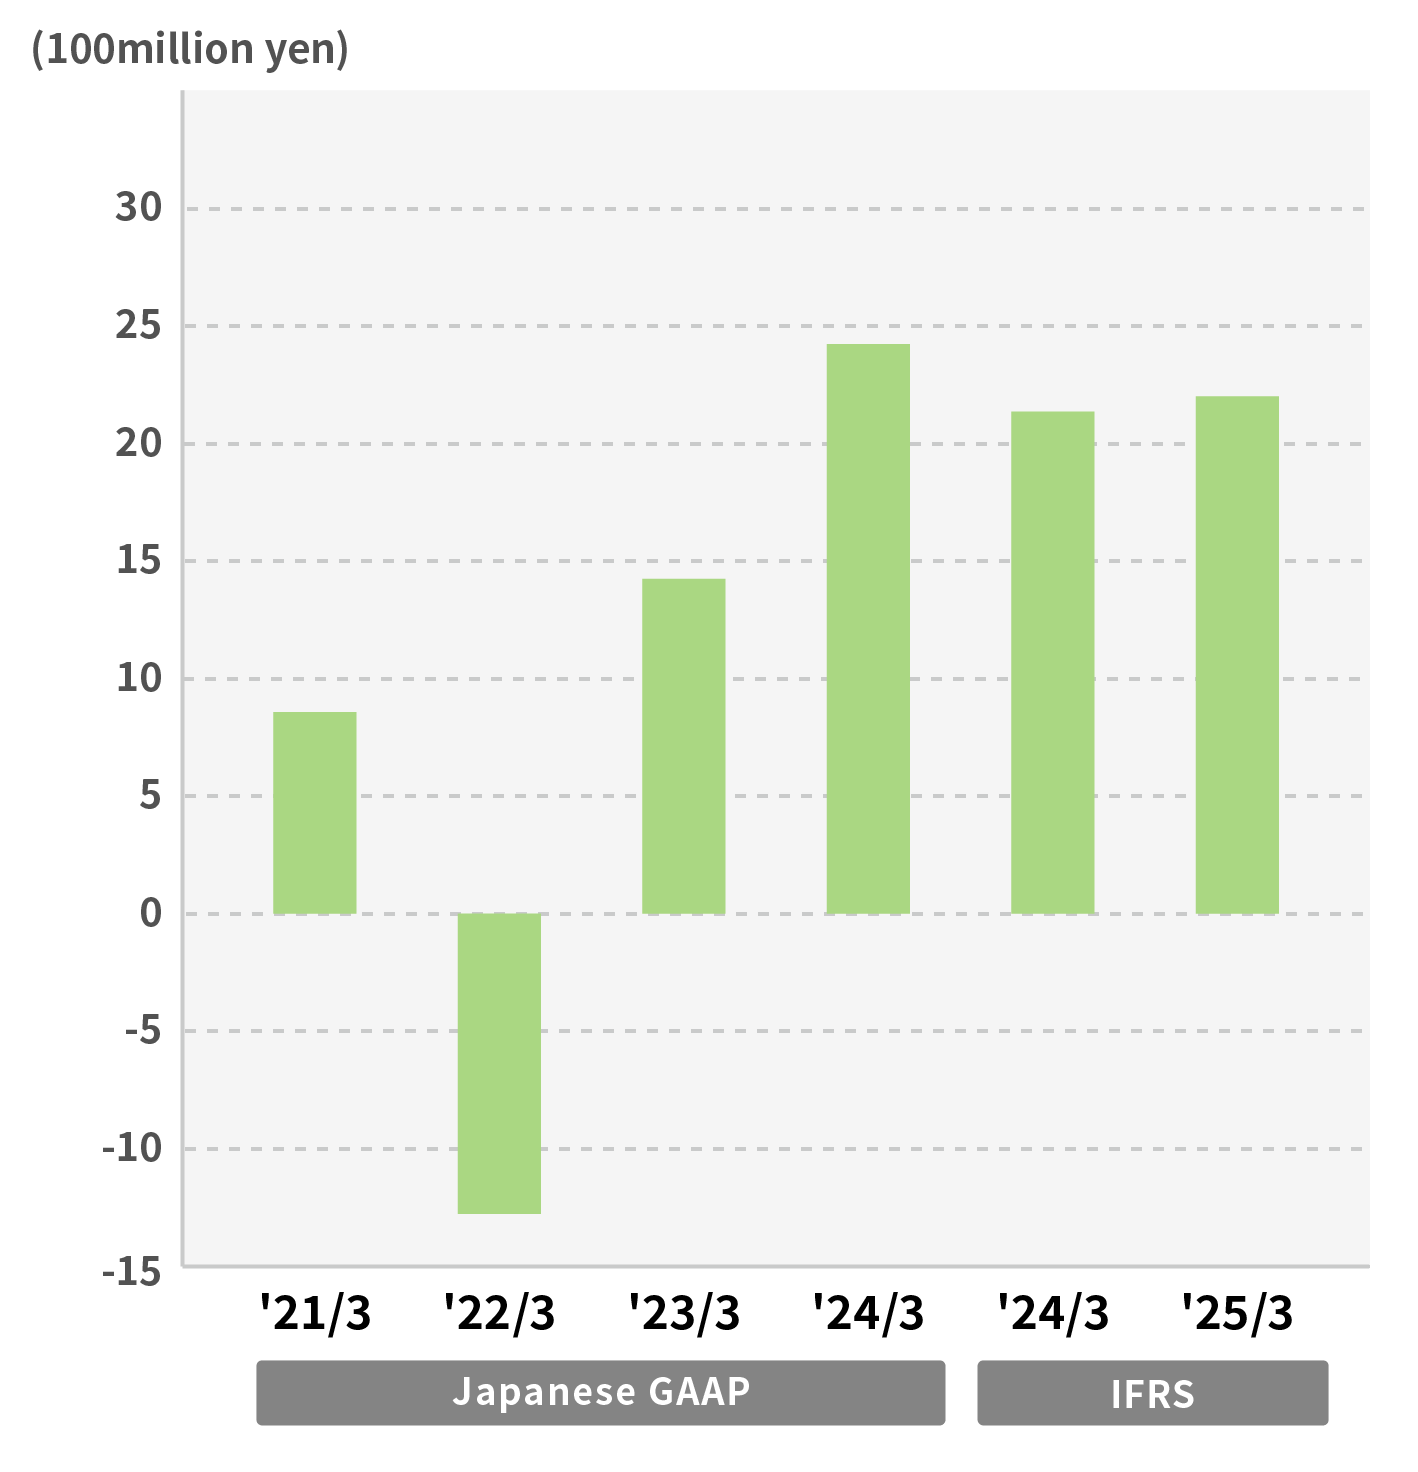
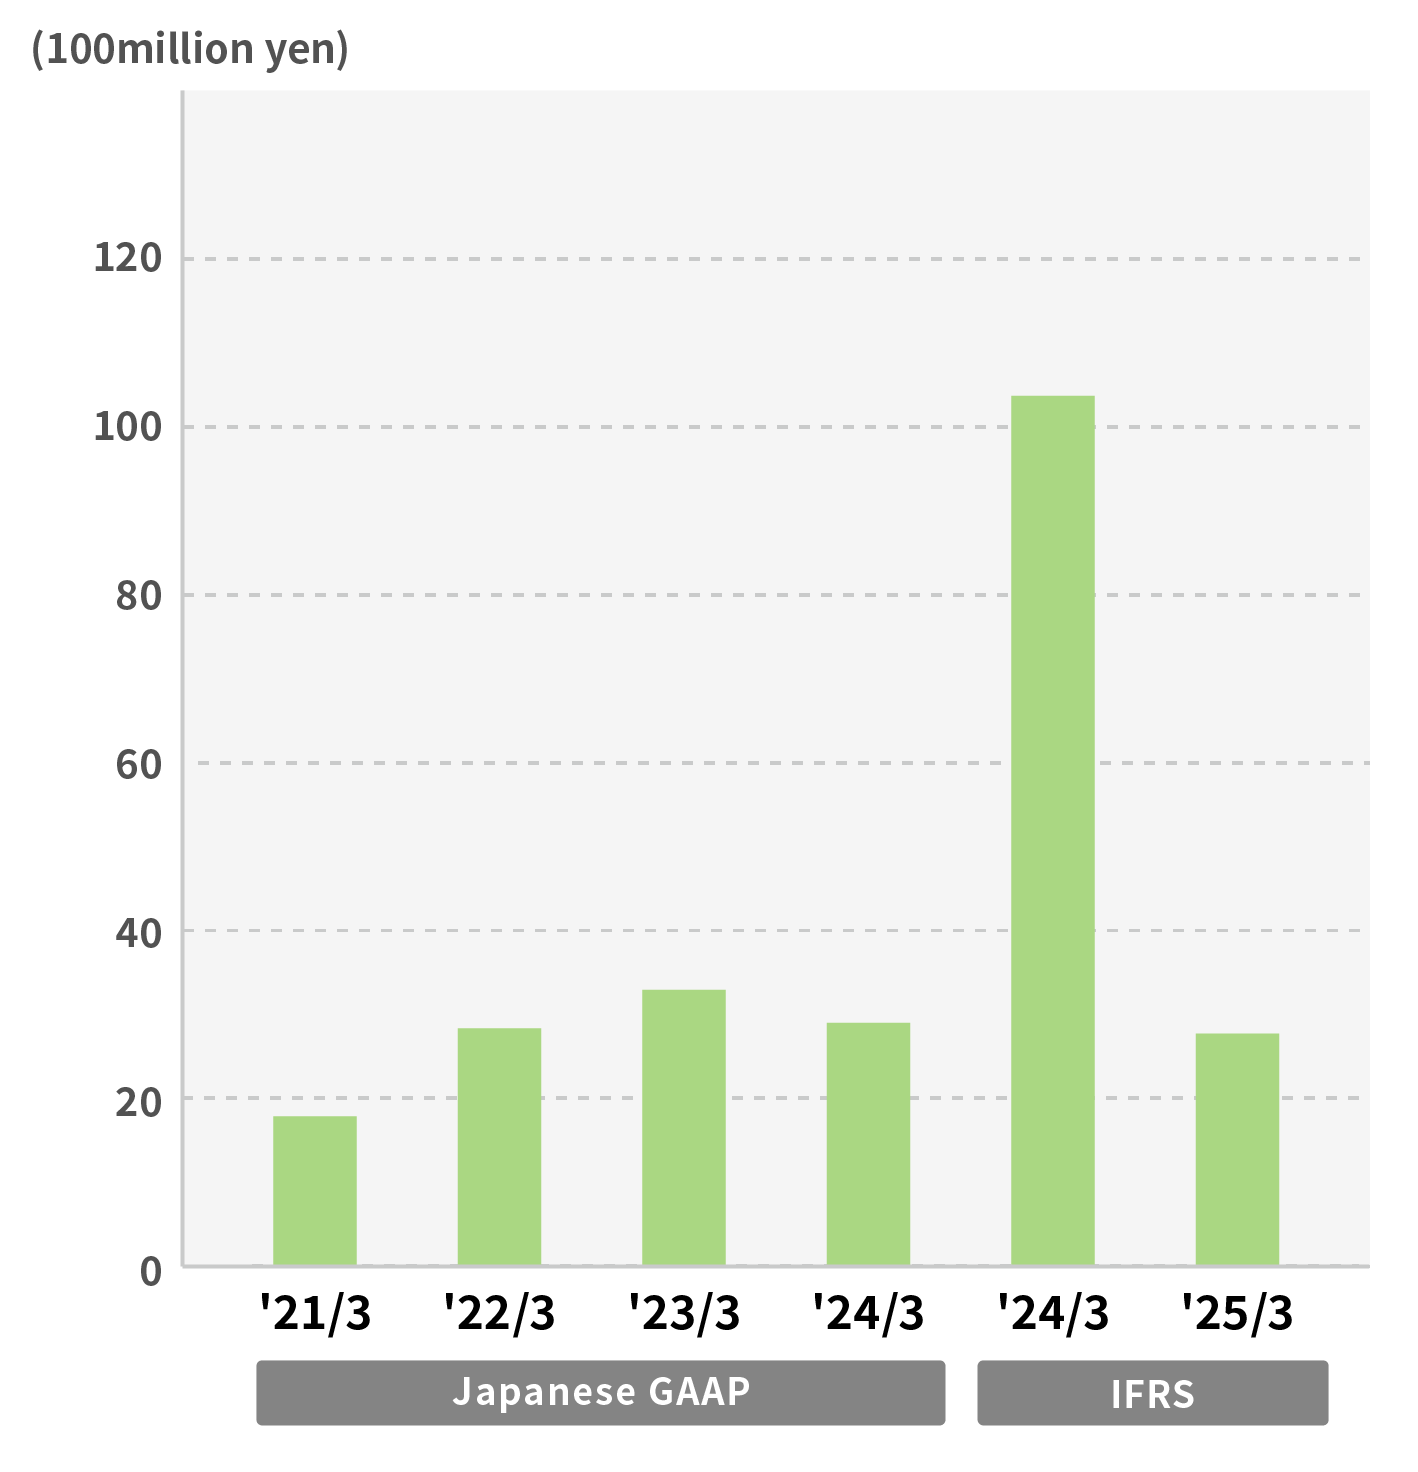
Segment operating income trends
[Specialty Steel]
[High Performance Materials and Magnetic Materials]
[Parts for Automobile & Industrial Equipment]
[Specialty Steel]
[High Performance Materials and Magnetic Materials]
[Parts for Automobile & Industrial Equipment]
[Engineering]
[Trading & Service]
(Millions of Yen)
| 2022/3 | 2023/3 | 2024/3 | 2024/3〔IFRS〕 | 2025/3〔IFRS〕 | 2026/3〔IFRS〕 | ||
|---|---|---|---|---|---|---|---|
| Specialty Steel | Revenue/Net Sales | 197,803 | 214,770 | 219,021 | 218,743 | 210,162 | 207,781 |
| Operating Profit/Operating Income | 3,827 | 9,771 | 14,797 | 13,724 | 12,088 | 13,380 | |
|
High Performance Materials and Magnetic Materials |
Net Sales | 197,604 | 219,724 | 202,832 | 202,384 | 200,863 | 199,753 |
| Operating Income(Loss) | 26,650 | 24,286 | 14,432 | 10,275 | 11,028 | 14,884 | |
| Parts for Automobile & Industrial Equipment | Net Sales | 92,504 | 101,232 | 105,633 | 104,996 | 113,031 | 117,937 |
| Operating Income(Loss) | 4,979 | 8,217 | 7,539 | 5,719 | 11,337 | 8,160 | |
| Engineering | Net Sales | 18,214 | 18,956 | 23,117 | 23,091 | 24,067 | 26,625 |
| Operating Income(Loss) | -1,277 | 1,425 | 2,424 | 2,136 | 2,201 | 2,622 | |
| Trading & Service | Net Sales | 23,540 | 23,881 | 30,681 | 29,347 | 26,820 | 26,031 |
| Operating Income(Loss) | 2,834 | 3,293 | 2,900 | 10,369 | 2,770 | 3,022 | |
(Note)
- The company has disclosed its consolidated financial results based on International Financial Reporting Standards (IFRS) since FY2023.