
Font Size
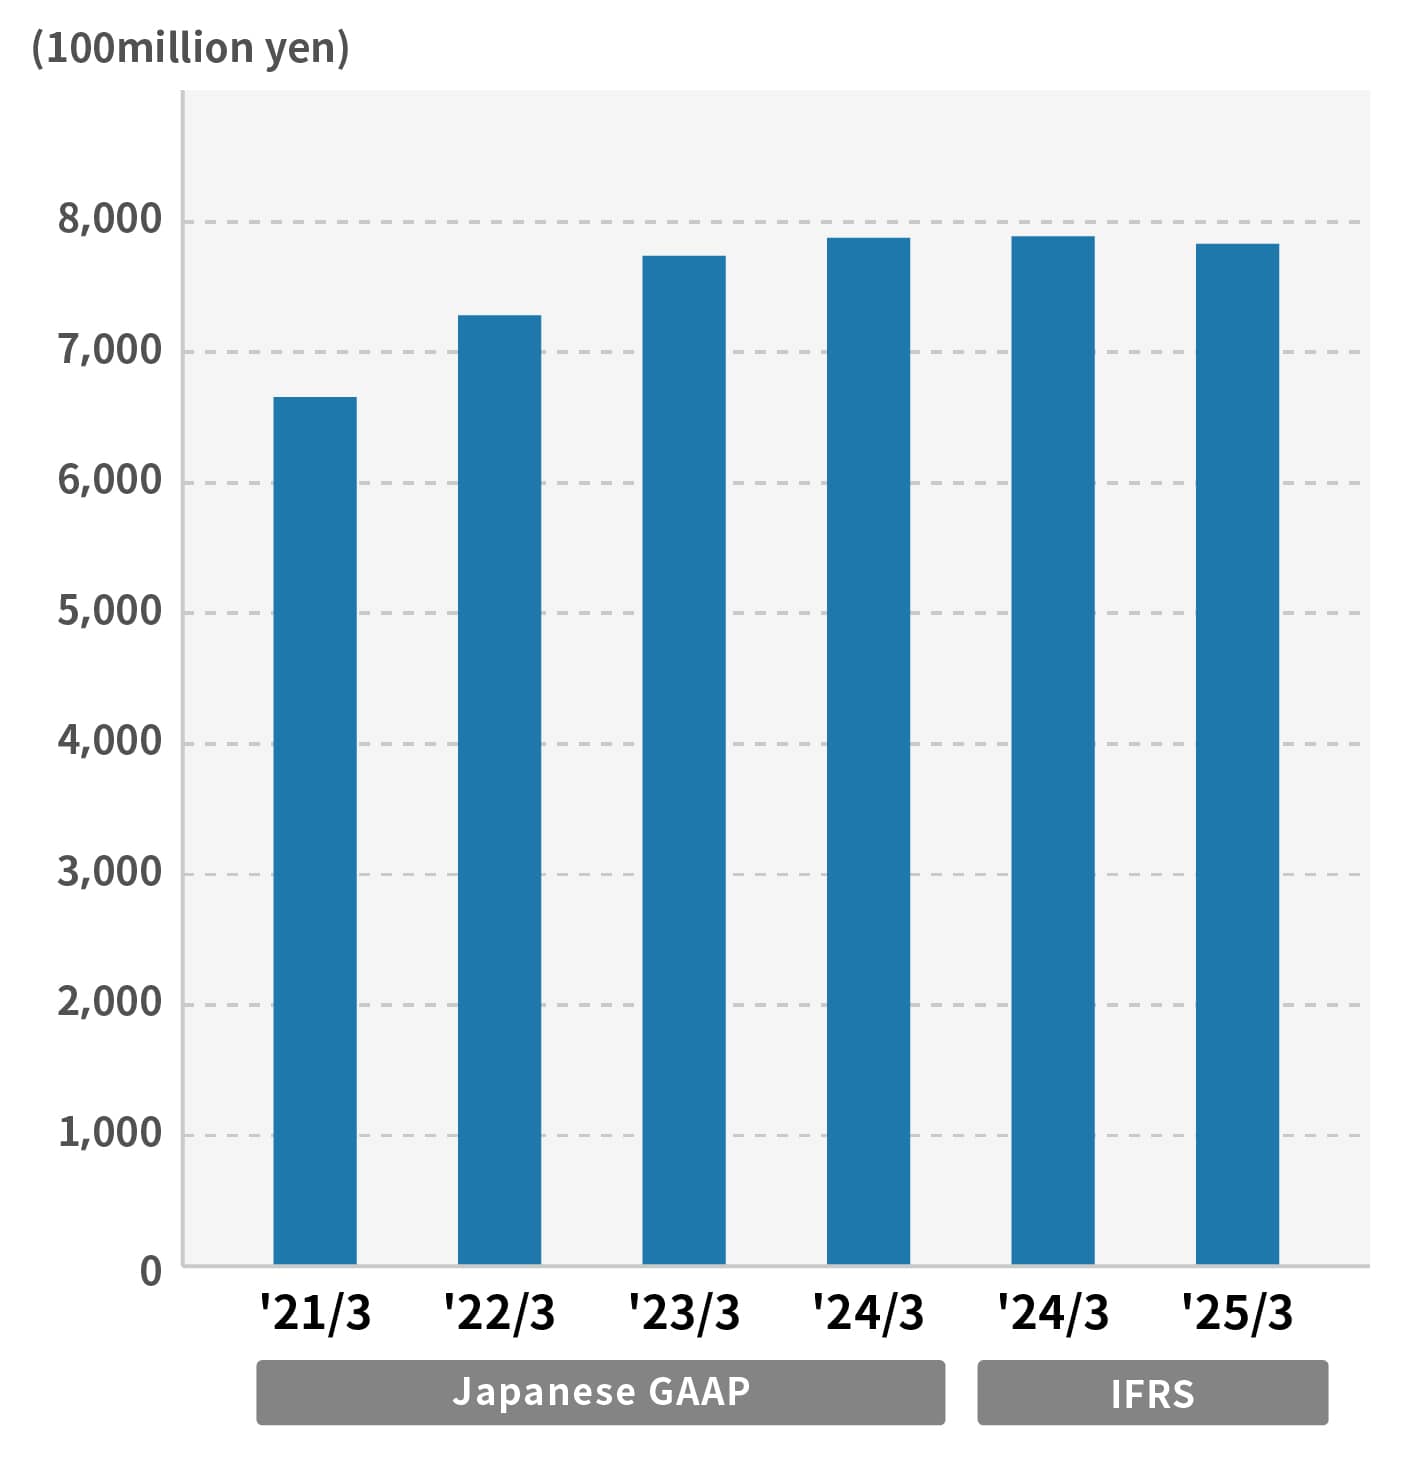
[Total assets]
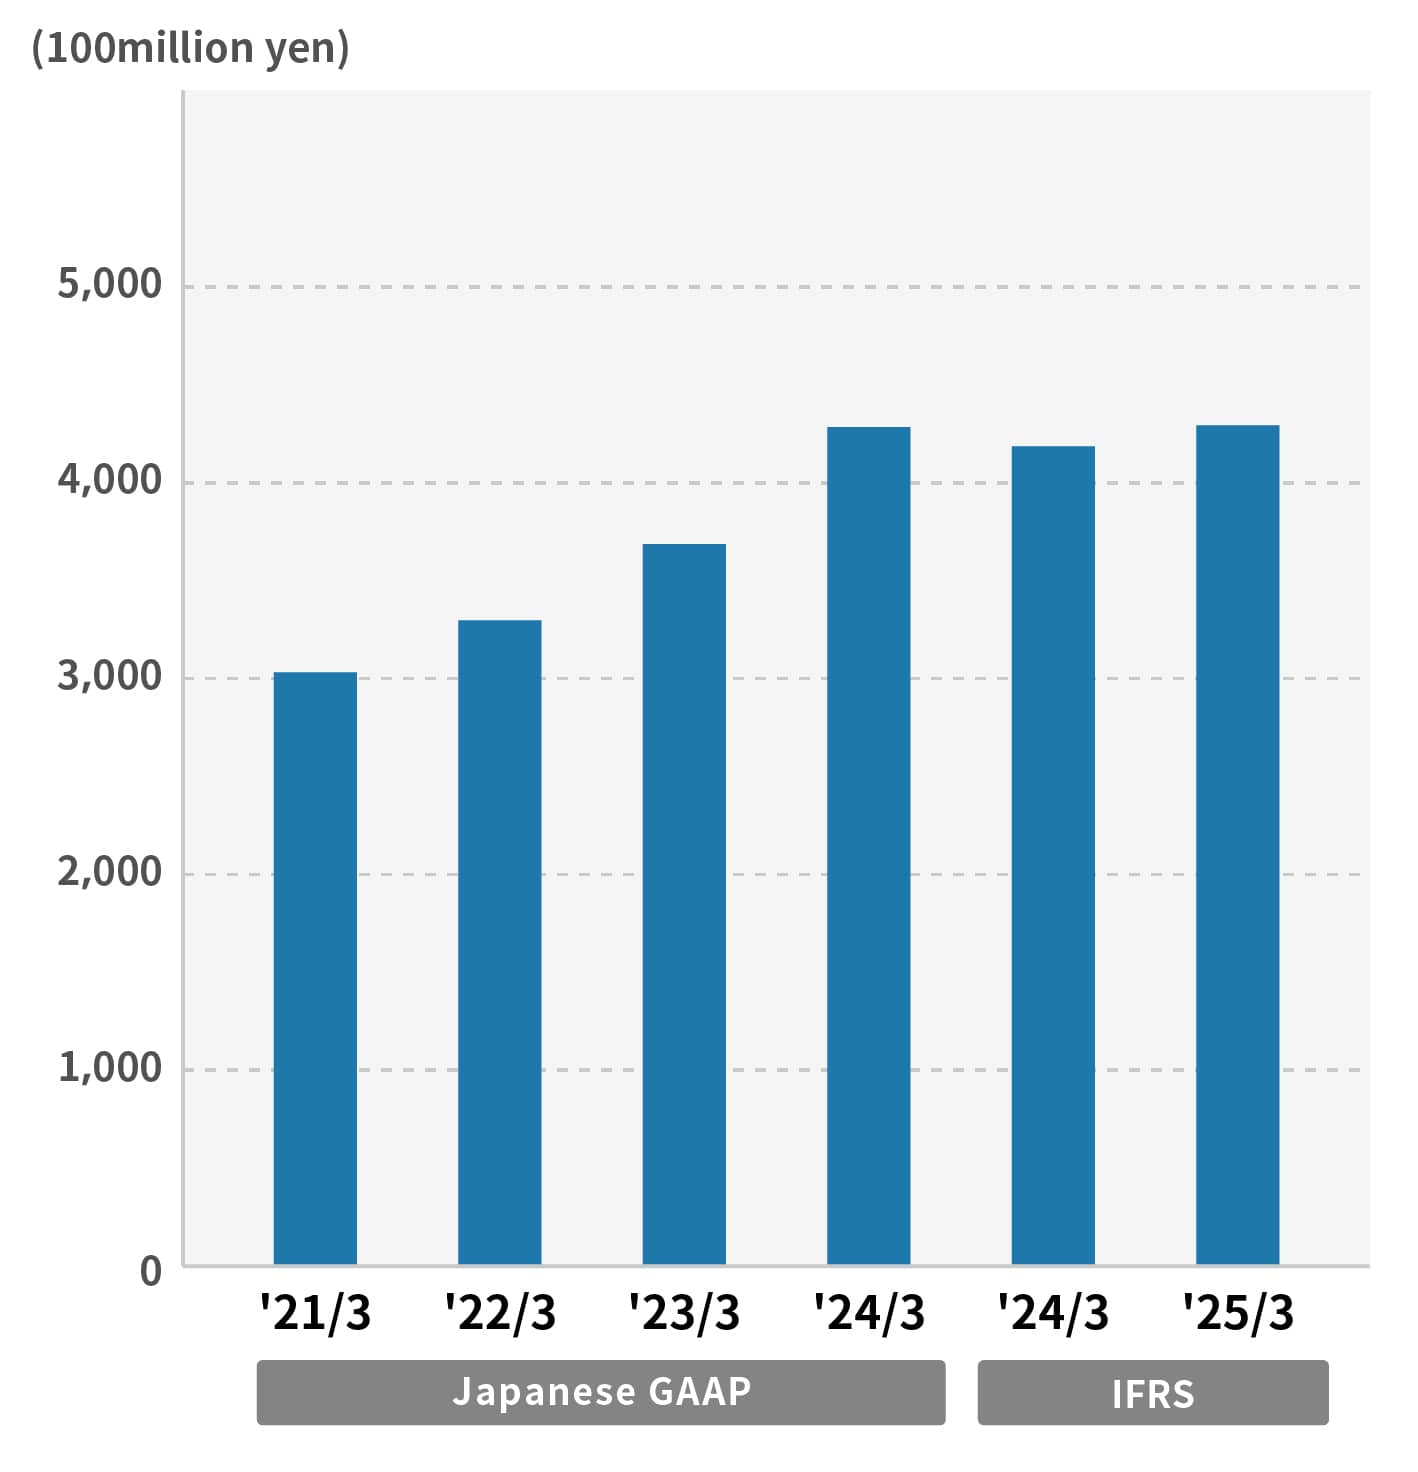
[Equity capital]
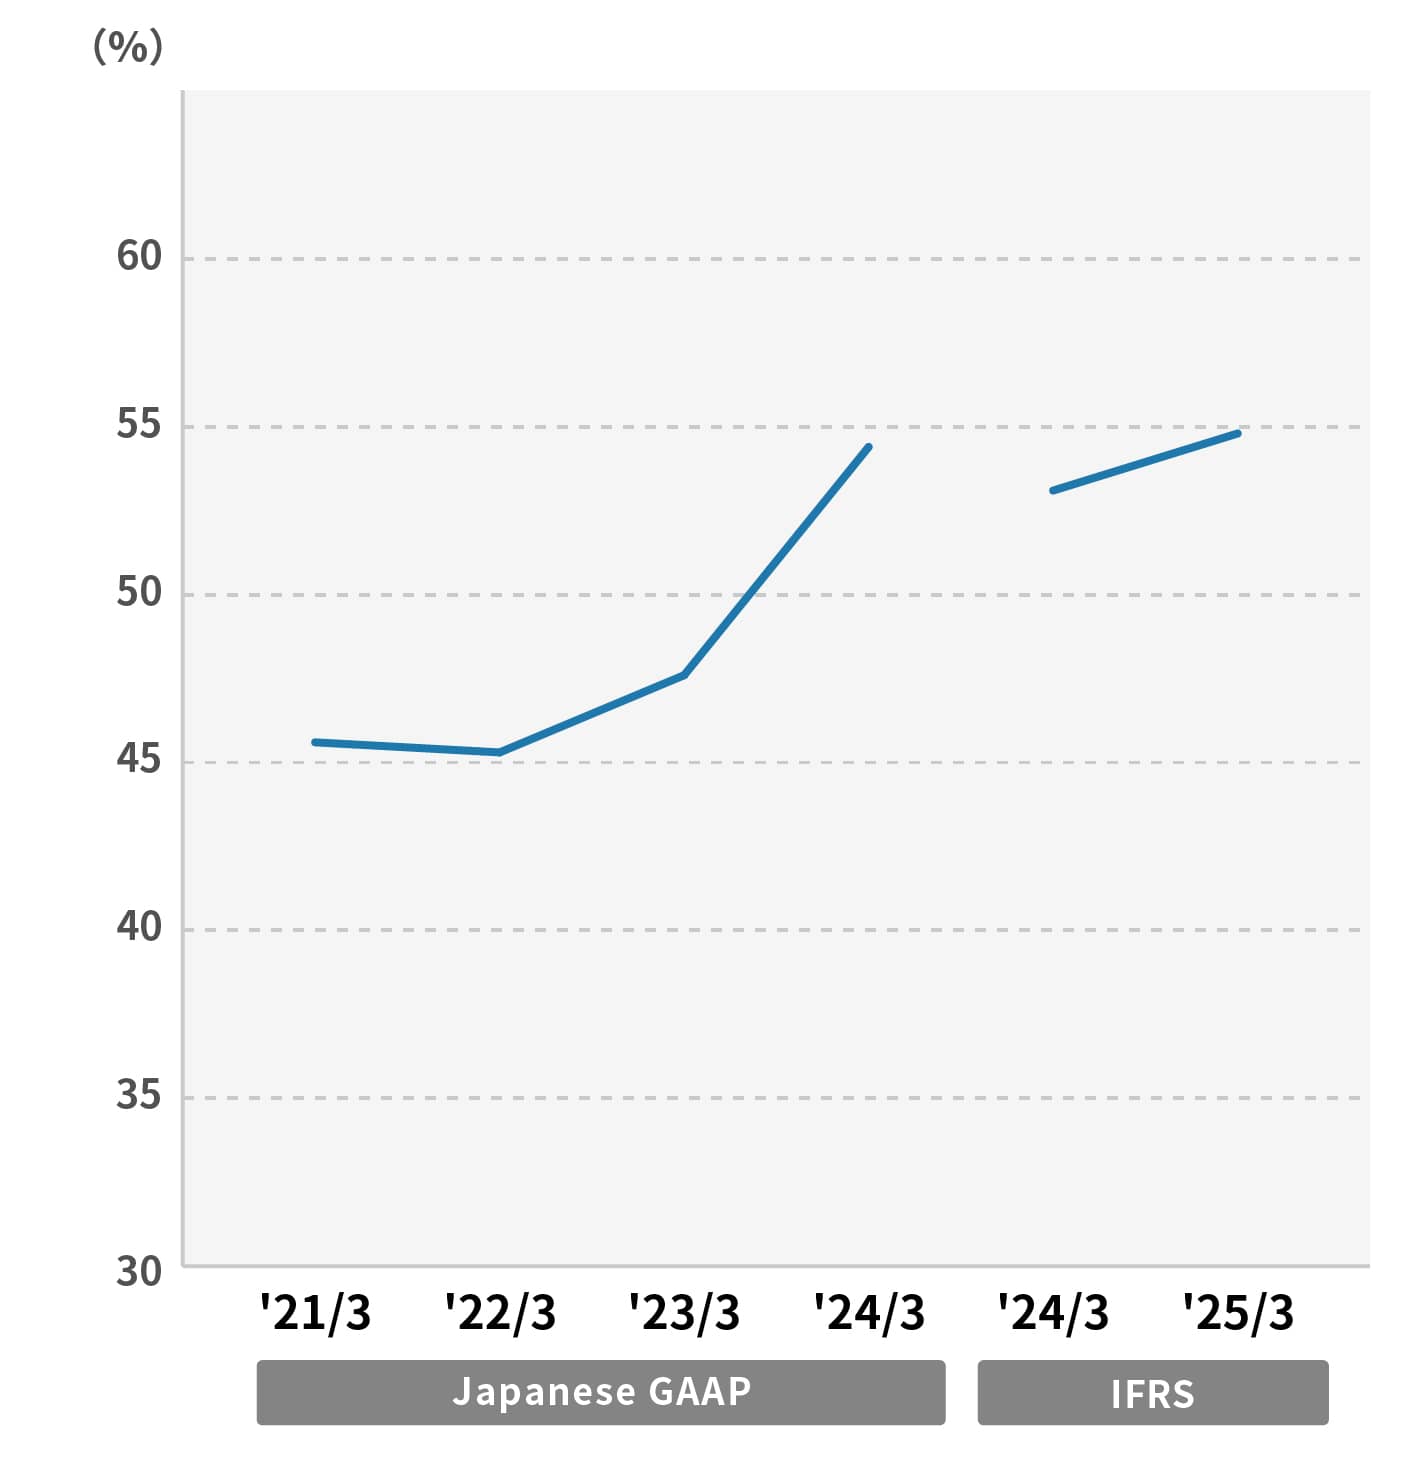
[Equity capital ratio]
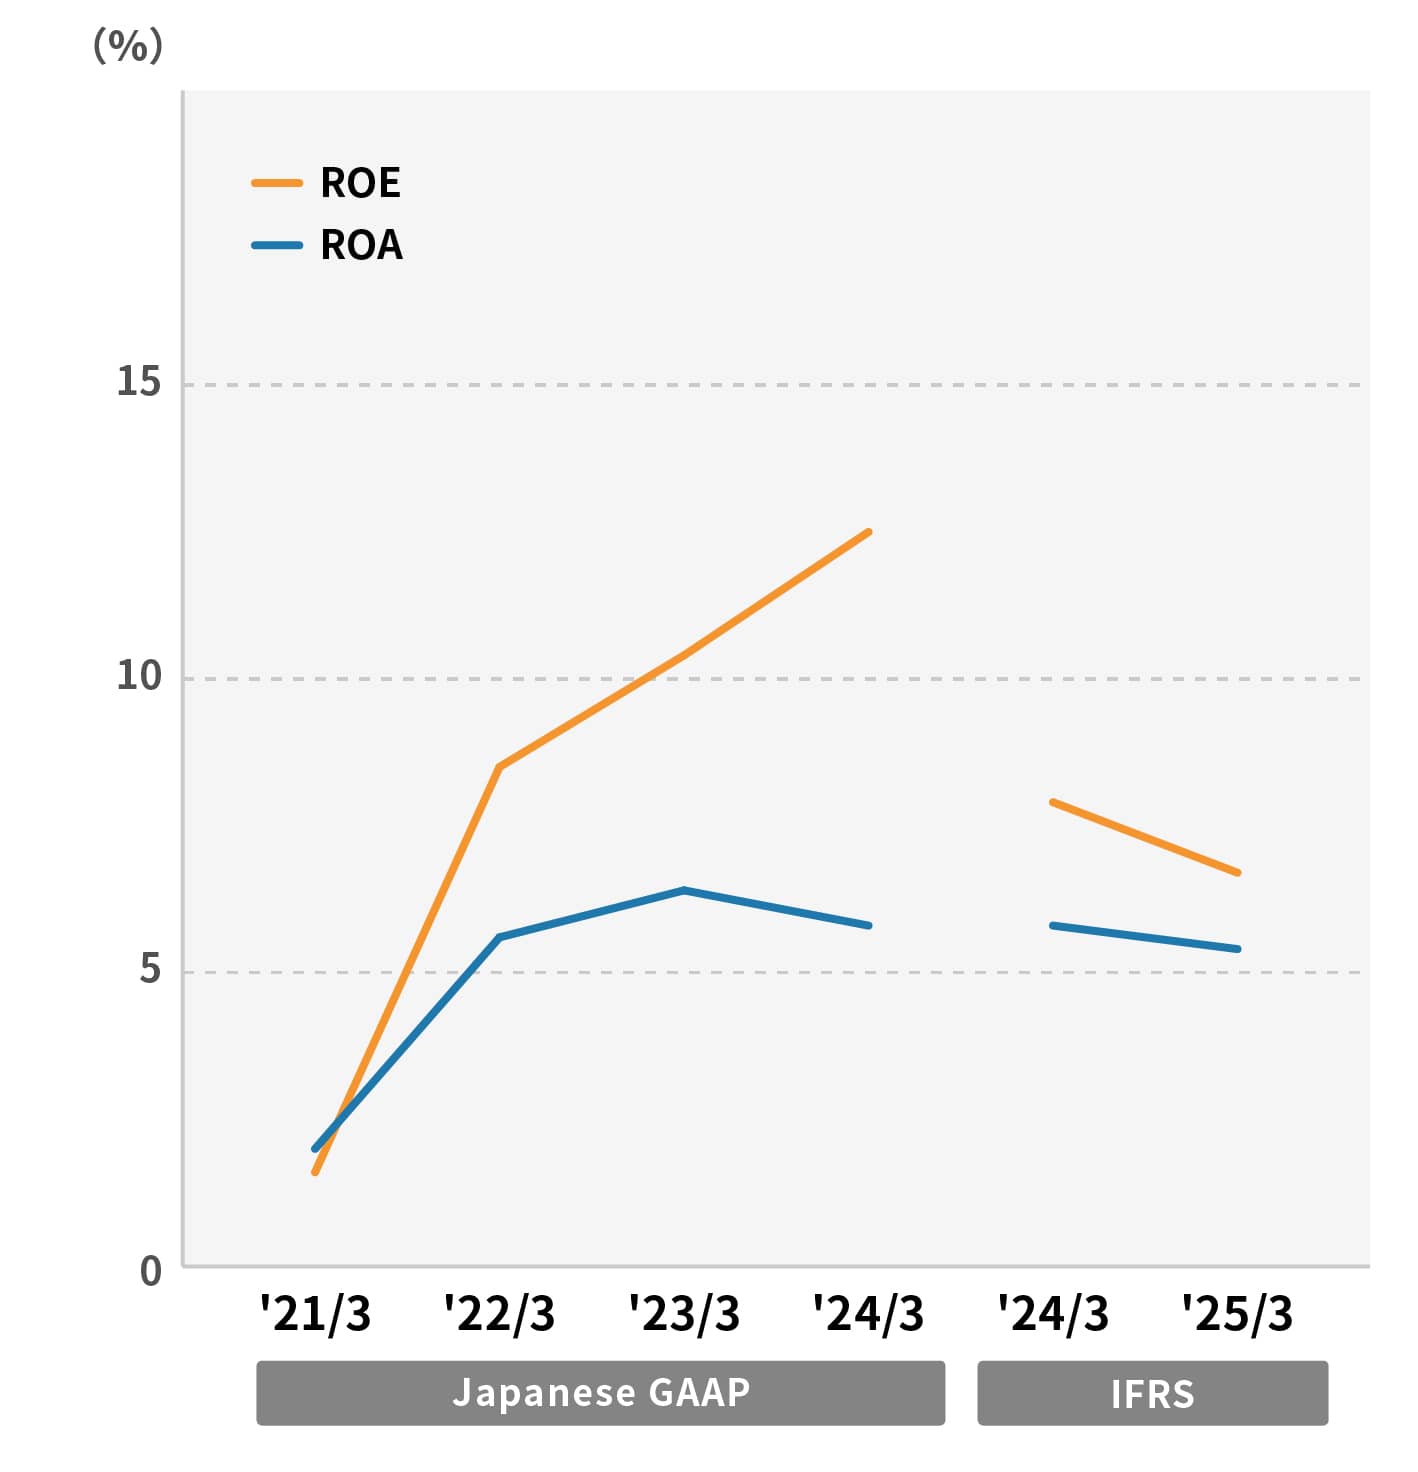
[ROA・ROE]
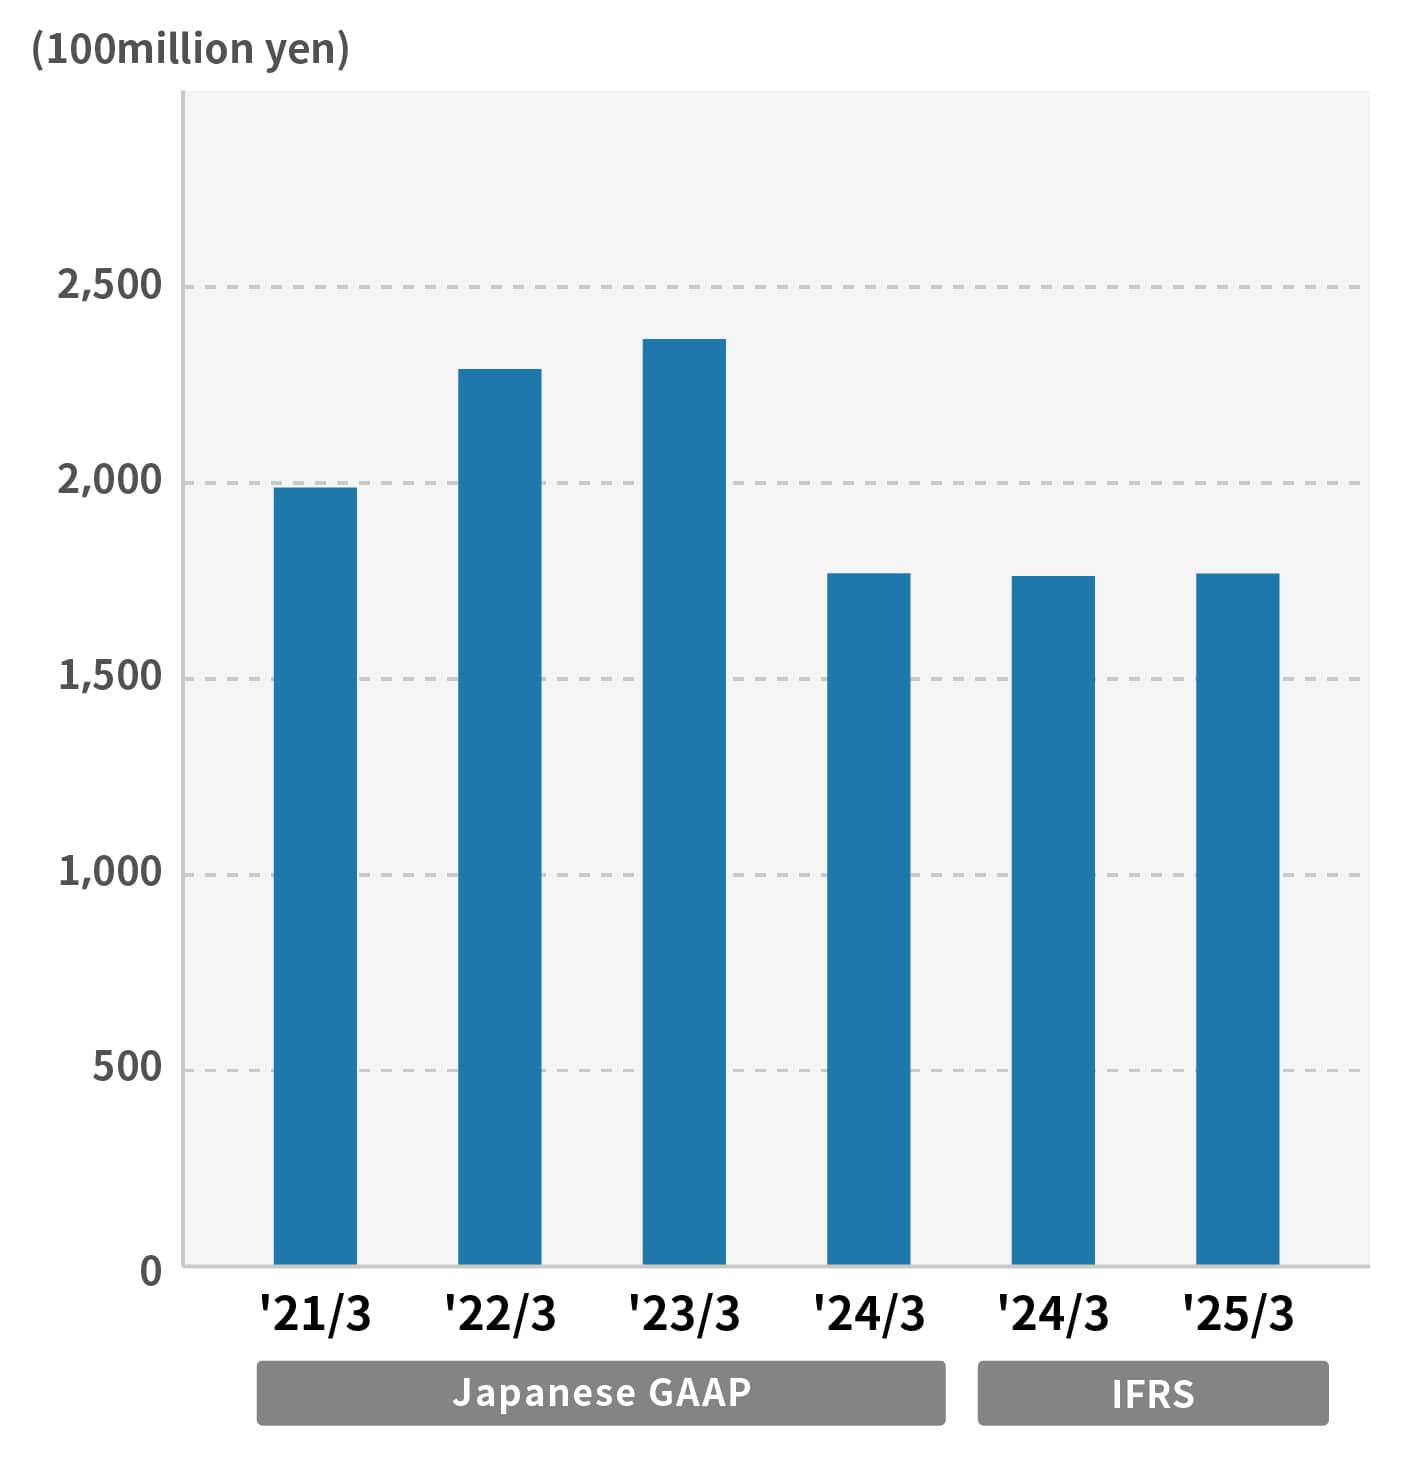
[Interest-Bearing Debts]
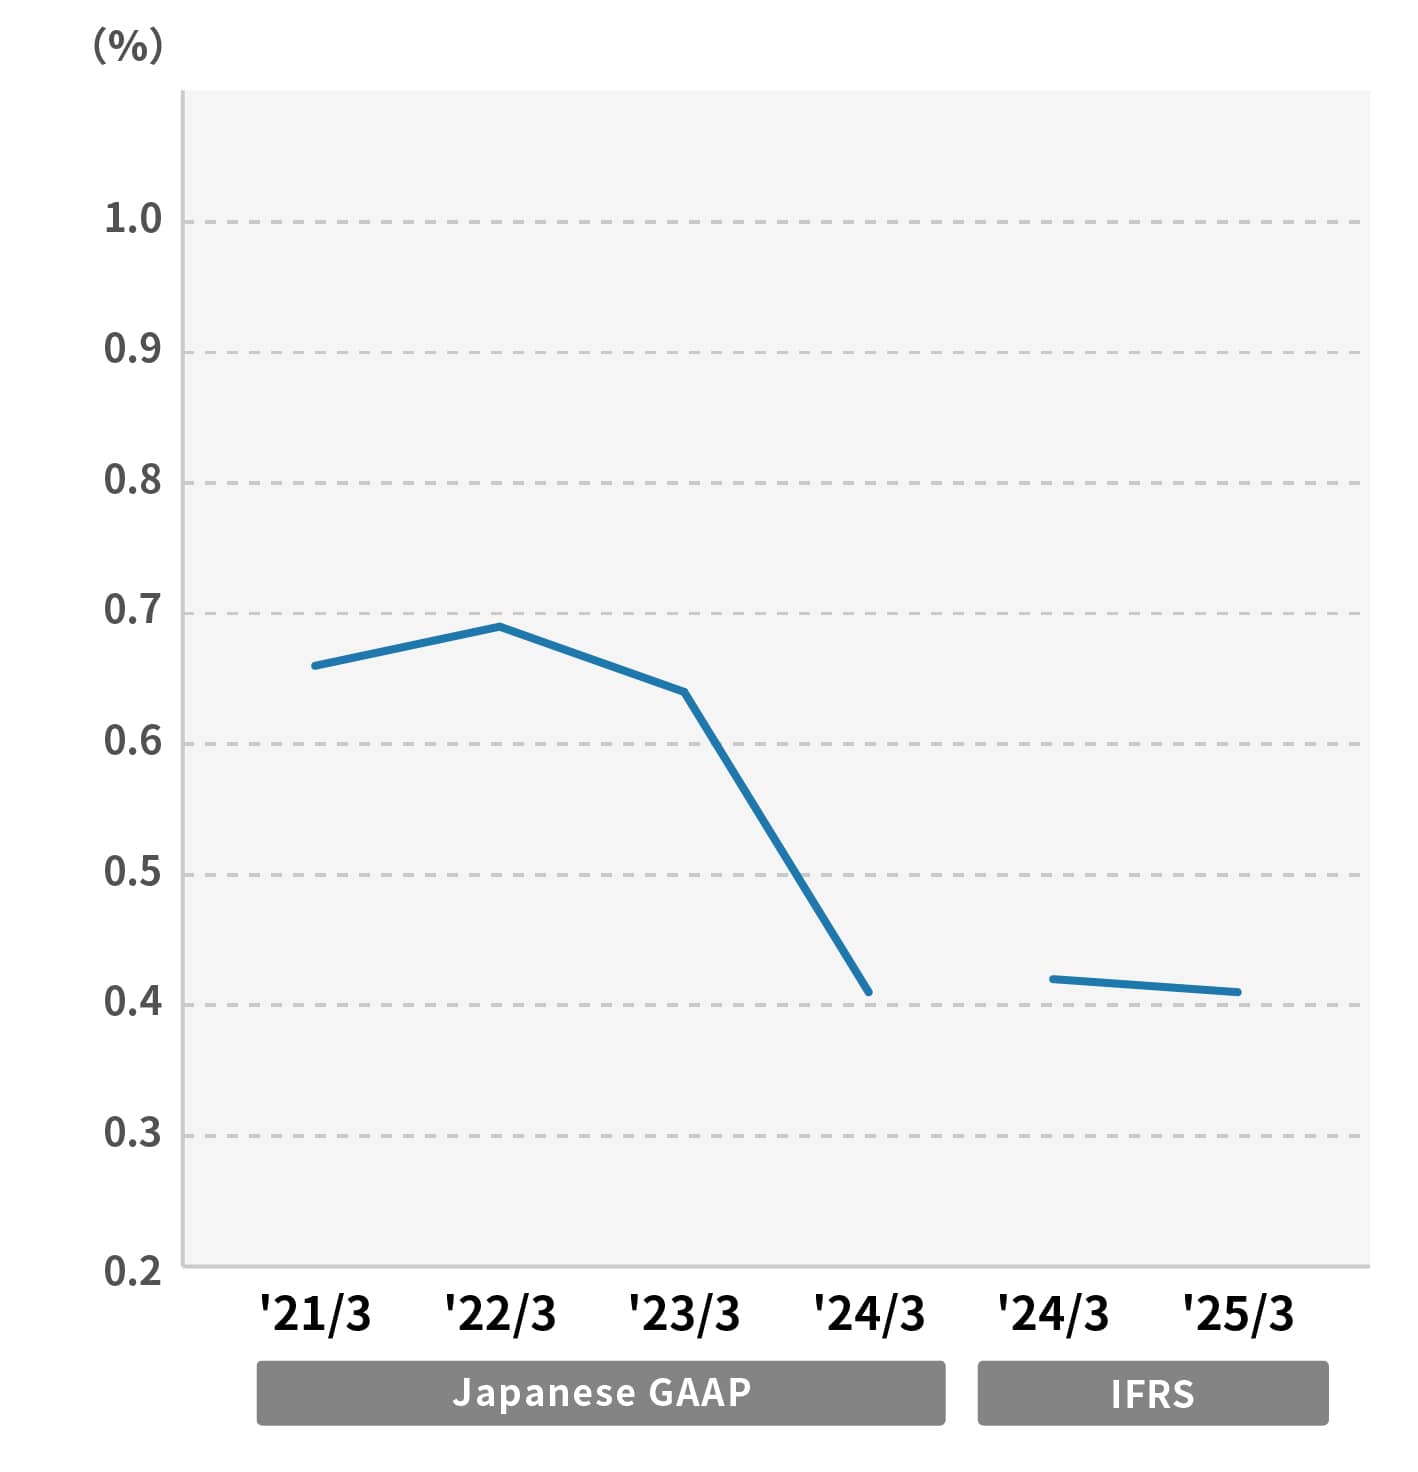
[D/E ratio]
(Millions of Yen)
| 2022/3 | 2023/3 | 2024/3 | 2024/3〔IFRS〕 | 2025/3〔IFRS〕 | 2026/3〔IFRS〕 | |
| Total assets | 728,187 | 773,851 | 787,517 | 788,734 | 782,974 | 856,380 |
| Equity capital | 329,713 | 368,718 | 428,359 | 418,562 | 429,278 | 472,565 |
| Equity capital ratio(%) | 45.3 | 47.6 | 54.4 | 53.1 | 54.8 | 55.2 |
| Return on assets(ROA)(%) | 5.6 | 6.4 | 5.8 | 5.8 | 5.4 | 5.5 |
| Return on equity(ROE)(%) | 1.6 | 8.5 | 10.4 | 12.5 | 7.9 | 6.7 |
| Interest-Bearing Debts | 229,090 | 236,761 | 176,933 | 176,235 | 176,848 | 181,761 |
| D/E ratio(times) | 0.69 | 0.64 | 0.41 | 0.42 | 0.41 | 0.38 |
(Note)
- The company has disclosed its consolidated financial results based on International Financial Reporting Standards (IFRS) since FY2023.
- ROA is the ratio of ordinary income to total assets under Japanese GAAP and the ratio of pre-tax income to total assets under IFRS.